
Bitcoin Fear and Greed Index Explained
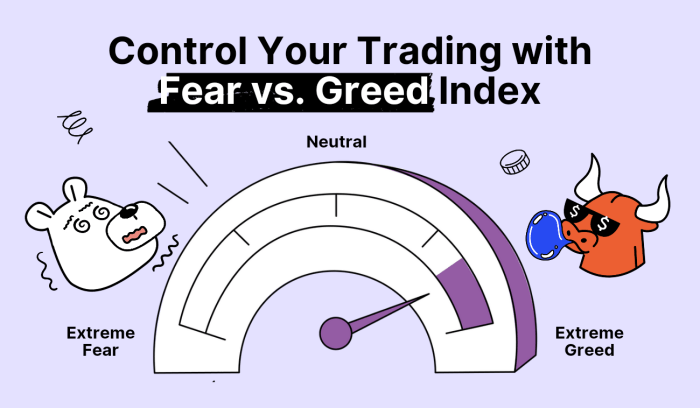
The Bitcoin Fear and Greed Index is a widely used metric that attempts to gauge the overall sentiment of the Bitcoin market. It provides a snapshot of whether investors are primarily driven by fear or greed, which can be a useful indicator of potential price movements, although it’s not a foolproof predictor. The index is presented as a numerical value ranging from 0 to 100, with lower numbers representing extreme fear and higher numbers indicating extreme greed.
The index’s methodology relies on a combination of several factors analyzed daily. These factors are weighted to reflect their perceived importance in influencing market sentiment. The exact weighting of these factors is not publicly disclosed by the creators of the index, adding an element of proprietary methodology.
Factors Influencing the Index
The Bitcoin Fear and Greed Index considers a variety of factors, including volatility (measured by price swings), market momentum (the direction and speed of price changes), social media sentiment (the overall tone of discussions surrounding Bitcoin on platforms like Twitter and Reddit), Bitcoin dominance (Bitcoin’s market share compared to other cryptocurrencies), and trading volume (the amount of Bitcoin being bought and sold). A significant increase in volatility, for example, might push the index towards “fear,” while sustained high trading volume coupled with positive social media sentiment could increase the “greed” component. These factors are aggregated into a single score, which is then categorized into different levels of fear and greed.
Historical Performance and Correlation with Events
Historically, the Bitcoin Fear and Greed Index has shown a correlation with Bitcoin’s price, though the relationship isn’t always direct or perfectly predictable. Periods of extreme fear (scores below 20) have often coincided with market bottoms, suggesting that these are potential buying opportunities. Conversely, periods of extreme greed (scores above 75) have sometimes preceded significant price corrections or market downturns. For example, the extreme greed seen in late 2017 preceded the substantial Bitcoin price correction in 2018. Similarly, the extreme fear observed during the market crash of March 2020 was followed by a significant price recovery. It’s important to note that these are just examples and past performance is not indicative of future results.
Impact of Fear and Greed Levels on Bitcoin Price
Different fear and greed levels have demonstrably impacted Bitcoin’s price historically. During periods of extreme fear, investors often panic sell, driving the price down. This creates a buying opportunity for those willing to take on more risk. Conversely, during periods of extreme greed, investors tend to be overconfident, leading to inflated prices that are often unsustainable. This increased buying pressure can push prices to unsustainable highs, setting the stage for potential corrections when sentiment shifts. For instance, the 2017 bull run saw the index reach extreme greed levels before the market experienced a significant correction. This illustrates how high levels of greed can precede price drops, as investors become overconfident and potentially overvalued assets are sold off.
Practical Applications of the Bitcoin Fear and Greed Index
The Bitcoin Fear and Greed Index provides valuable insights into market sentiment, offering opportunities for informed trading decisions. While not a perfect predictor, it acts as a helpful supplementary tool when combined with other technical and fundamental analyses. Understanding how to interpret and utilize this index can significantly improve risk management and potentially enhance investment returns.
Designing a Trading Strategy Incorporating the Fear and Greed Index
A robust trading strategy using the Fear and Greed Index should not rely solely on the index but rather integrate it with other market indicators. One approach is to consider extreme fear (low index values) as potential buying opportunities and extreme greed (high index values) as potential selling opportunities. However, this should be coupled with technical analysis, such as support and resistance levels, moving averages, and relative strength index (RSI), to confirm potential entry and exit points. For instance, a trader might identify a strong support level on a chart alongside an extremely low Fear and Greed Index score, indicating a possible bottoming-out of the market and a favorable buying opportunity. Conversely, a high index score coupled with an overbought RSI might signal an impending correction, prompting a sell order. It’s crucial to remember that the index lags market movements, so timing is critical.
Identifying Potential Buying and Selling Opportunities Using the Index
The index helps identify potential market turning points. When the index shows extreme fear (e.g., below 20), it suggests a pessimistic market sentiment, potentially indicating a buying opportunity. Conversely, extreme greed (e.g., above 75) suggests an overly optimistic market, potentially signaling a selling opportunity. It’s important to note that these are not guaranteed signals, and other factors should be considered. For example, a historically low index reading might coincide with a period of fundamental weakness in the Bitcoin market, making a purchase unwise despite the seemingly attractive valuation. Conversely, a high index reading during a period of sustained growth and positive news might indicate a healthy market, suggesting the potential for further gains.
Risk Management Techniques for Investors Using the Index
Effective risk management is paramount when employing the Fear and Greed Index. Investors should avoid making all-in bets based solely on the index. Diversification across other assets is crucial. Position sizing is vital – never invest more than you can afford to lose. Stop-loss orders should be implemented to limit potential losses. Furthermore, a thorough understanding of your own risk tolerance is essential. For example, an investor with a high-risk tolerance might consider allocating a larger portion of their portfolio to Bitcoin during periods of extreme fear, while a conservative investor might prefer a smaller allocation or wait for confirmation from other indicators before entering the market.
Hypothetical Portfolio Allocation Strategy Based on Different Index Levels
A hypothetical portfolio allocation strategy might look like this:
| Fear & Greed Index Level | Bitcoin Allocation (%) | Stablecoin Allocation (%) | Other Assets Allocation (%) |
|---|---|---|---|
| 0-20 (Extreme Fear) | 70 | 20 | 10 |
| 21-40 (Fear) | 50 | 30 | 20 |
| 41-60 (Neutral) | 30 | 40 | 30 |
| 61-80 (Greed) | 20 | 50 | 30 |
| 81-100 (Extreme Greed) | 10 | 60 | 30 |
This is a simplified example and should be adjusted based on individual risk tolerance and market conditions. It highlights the principle of reducing Bitcoin exposure as the index moves towards extreme greed and increasing it during extreme fear. Remember, this is a hypothetical strategy, and past performance does not guarantee future results.
The Relationship Between Bitcoin Price and the Fear and Greed Index
The Bitcoin Fear and Greed Index, while not a perfect predictor, offers valuable insights into market sentiment and can be correlated with Bitcoin price movements. By analyzing historical data, we can observe a general relationship, although the correlation isn’t always straightforward or perfectly predictive. Understanding this relationship requires considering both instances where the index aligns with price trends and those where it diverges.
The Fear and Greed Index reflects the overall sentiment of the Bitcoin market, ranging from extreme fear to extreme greed. Generally, periods of extreme fear are associated with lower Bitcoin prices, as investors sell off their holdings, while periods of extreme greed often precede price corrections as overvaluation becomes apparent. However, it’s crucial to remember that the index is just one factor among many influencing Bitcoin’s price.
Correlation Between the Index and Bitcoin Price Movements
Historical data shows a tendency for Bitcoin’s price to decline during periods of extreme fear and to rise during periods of extreme greed, but this relationship isn’t consistently strong. For example, during the 2018 bear market, the Fear and Greed Index consistently registered in the “extreme fear” zone for extended periods, accurately reflecting the significant price drop. Conversely, in late 2020 and early 2021, a surge in “extreme greed” preceded a substantial price increase, demonstrating a positive correlation. However, there have been instances where the index didn’t accurately predict price movements. For example, some periods of high fear haven’t necessarily led to immediate price drops, and vice versa.
Instances of Accurate and Inaccurate Predictions
Several instances illustrate the index’s predictive power and limitations. The 2017 bull run saw a gradual increase in the Greed Index, culminating in extreme greed before the market correction. This demonstrates a positive correlation where high greed levels preceded a price drop. Conversely, during the 2020 halving, the market experienced significant price appreciation despite lingering fear, highlighting the index’s limitations in accurately predicting price direction. It’s crucial to note that external factors, such as regulatory announcements or macroeconomic events, can significantly influence Bitcoin’s price, overriding the influence of market sentiment captured by the index.
Limitations and Biases in Using the Index as a Sole Indicator
Relying solely on the Fear and Greed Index to predict Bitcoin’s price is inherently risky. The index is a lagging indicator, meaning it reflects past market sentiment rather than predicting future price movements. Furthermore, the index’s calculation methodology may introduce biases, as it’s based on a limited set of factors such as social media sentiment, volatility, and trading volume. These factors don’t always comprehensively capture the complexities of the Bitcoin market. External factors like regulatory changes, technological developments, and macroeconomic conditions significantly impact Bitcoin’s price, making the Fear and Greed Index an incomplete tool for price prediction.
Comparison with Other Market Indicators
The Bitcoin Fear and Greed Index should be used in conjunction with other market indicators for a more comprehensive analysis. Technical indicators like moving averages, relative strength index (RSI), and Bollinger Bands, alongside on-chain metrics such as the miner’s net position and the number of active addresses, offer additional perspectives on market dynamics. Combining these indicators with the Fear and Greed Index provides a more nuanced understanding of market sentiment and potential price trends. For example, a high Fear and Greed Index score coupled with bearish technical indicators might suggest a higher probability of a price correction, while the opposite scenario might signal potential upward momentum. However, even a comprehensive analysis incorporating multiple indicators doesn’t guarantee accurate price predictions. The inherent volatility of Bitcoin makes precise forecasting extremely challenging.
Bitcoin Fear and Greed
The Bitcoin Fear and Greed Index provides a snapshot of market sentiment, but understanding its long-term implications requires analyzing its historical performance alongside Bitcoin’s price movements and broader market forces. A long-term perspective reveals cyclical patterns and highlights the influence of technological advancements and regulatory landscapes on investor behavior.
Long-Term Trends in Bitcoin Price and the Fear and Greed Index
Analyzing the Bitcoin Fear and Greed Index alongside Bitcoin’s price history reveals a strong correlation, albeit not a perfect one. Historically, periods of extreme fear (low index values) have often coincided with significant price troughs, representing potential buying opportunities. Conversely, extreme greed (high index values) has frequently preceded price corrections or bear markets. However, the index isn’t a perfect predictor; it reflects sentiment, not necessarily future price movements. Observing the index’s historical data reveals recurring cycles of fear and greed, mirroring the broader boom-and-bust cycles characteristic of Bitcoin’s price. For example, the 2017 bull market saw the index consistently in the “extreme greed” range before the subsequent crash, while the 2018 bear market was characterized by prolonged periods of “extreme fear.” These historical patterns offer valuable context for interpreting current index levels.
Market Cycles and Technological Advancements Influence Investor Sentiment
Bitcoin’s price is inherently cyclical, driven by factors like adoption rates, technological advancements, and macroeconomic conditions. These cycles significantly influence the Fear and Greed Index. Major technological upgrades, such as the implementation of the Lightning Network or the development of new privacy-enhancing features, often generate positive sentiment and push the index towards “greed.” Conversely, periods of network congestion or security vulnerabilities can lead to fear and a drop in the index. The halving events, which reduce the rate of Bitcoin’s creation, have also historically influenced investor sentiment, often leading to periods of increased anticipation and subsequent price increases. The resulting shifts in investor sentiment are reflected in the Fear and Greed Index, illustrating its responsiveness to significant market events.
Regulatory Changes Impact on Investor Fear and Greed
Regulatory actions and announcements from governments worldwide profoundly impact investor sentiment. Negative regulatory news, such as outright bans or stringent regulations, typically fuels fear and pushes the index downwards. Conversely, positive regulatory developments, like the establishment of clear regulatory frameworks or the adoption of Bitcoin by institutional investors, can boost confidence and drive the index towards “greed.” The uncertainty surrounding regulatory clarity often creates volatility, influencing the Fear and Greed Index’s fluctuations. For instance, announcements regarding cryptocurrency taxation or licensing requirements have historically caused significant swings in the index.
Future Evolution of the Bitcoin Fear and Greed Index
Predicting the future evolution of the Bitcoin Fear and Greed Index is inherently challenging. However, considering historical trends and the evolving cryptocurrency landscape, we can anticipate continued influence from technological advancements, regulatory developments, and macroeconomic factors. As Bitcoin matures and its adoption increases, the index might become less volatile, reflecting a more stable and less emotionally driven market. The emergence of new cryptocurrencies and technologies could also influence the index, potentially creating new sources of both fear and greed. The increasing institutional involvement in the Bitcoin market could also lead to a more rational and less emotionally driven response to price fluctuations, potentially dampening the extreme swings observed in the past. The long-term trajectory of the index will likely reflect the overall maturation and integration of Bitcoin into the global financial system.
Frequently Asked Questions (FAQs) about Bitcoin Fear and Greed
The Bitcoin Fear and Greed Index is a useful tool for navigating the volatile world of cryptocurrency, but understanding how it works and its limitations is crucial. This section addresses common questions to help you interpret and apply this indicator effectively.
The Bitcoin Fear and Greed Index
The Bitcoin Fear and Greed Index is a metric that attempts to gauge the overall sentiment of the Bitcoin market, ranging from extreme fear (0) to extreme greed (100). It’s a composite index drawing on various market factors to provide a snapshot of investor emotion. A higher score generally suggests more bullish sentiment, while a lower score points to bearish sentiment.
The Index Calculation
The index’s calculation is proprietary and not publicly revealed in full detail by its creators. However, it’s understood to consider several factors, including volatility, market momentum, social media sentiment, and Bitcoin’s trading volume. Each factor is weighted, and the resulting score is a reflection of the combined influence of these elements. The exact weighting and algorithms remain confidential, contributing to some ambiguity in its interpretation.
The Index as a Bitcoin Price Predictor
The Bitcoin Fear and Greed Index is not a perfect predictor of Bitcoin’s price. While it offers valuable insights into market sentiment, it’s essential to remember that it’s just one factor among many. For example, a period of extreme greed might not always immediately precede a price drop, and vice-versa. External events, regulatory changes, or technological developments can significantly impact Bitcoin’s price regardless of the index’s reading. Its strength lies in providing context to price movements, highlighting potential market extremes, rather than offering precise price predictions.
Using the Index in Investment Strategies
The index can be a helpful tool within a broader investment strategy. For instance, a reading of extreme fear might signal a potential buying opportunity for long-term investors, while extreme greed might suggest caution or even partial profit-taking. However, it shouldn’t be the sole basis for investment decisions. A comprehensive strategy should also consider fundamental analysis, technical analysis, and risk tolerance. Investors should always conduct thorough research and diversify their portfolios. Using the index alongside other indicators can provide a more nuanced perspective.
Finding the Bitcoin Fear and Greed Index
The Bitcoin Fear and Greed Index is readily available online from several sources. Many financial news websites and cryptocurrency data platforms feature it prominently. A simple web search for “Bitcoin Fear and Greed Index” will readily provide access to various sources displaying the current index value and its historical data. It is important to note that while multiple sources may display the index, the underlying data and calculations remain largely the same across different providers.
Illustrative Examples
Understanding the interplay between Bitcoin’s price and the Fear & Greed Index requires examining historical data. Analyzing past instances of high fear and high greed provides valuable insights into market behavior and potential investment strategies. The following examples illustrate these dynamics.
Historical Bitcoin Price Movements and Fear & Greed Index Values
The table below presents a snapshot of Bitcoin’s price and the corresponding Fear & Greed Index at specific points in time. Note that these are illustrative examples and do not encompass the entire history of Bitcoin. The Fear & Greed Index values are approximations and can vary slightly depending on the source.
| Date | Bitcoin Price (USD) | Fear & Greed Index | Market Event Description |
|---|---|---|---|
| December 2017 | ~19,783 | Extreme Greed | Bitcoin reached its all-time high at the time, fueled by intense speculation and media hype. Regulatory uncertainty was already starting to emerge. |
| November 2018 | ~3,400 | Extreme Fear | A significant market correction occurred, driven by concerns about regulation, security breaches, and overall market volatility. |
| December 2020 | ~23,000 | Greed | Institutional investors began showing increased interest in Bitcoin, driving a renewed price surge. |
| May 2021 | ~58,000 | Greed | Elon Musk’s positive tweets and Tesla’s Bitcoin investment contributed to a period of heightened investor enthusiasm. |
High-Fear Scenario and Impact on Bitcoin Price
During the cryptocurrency market crash of late 2018, the Fear & Greed Index registered “Extreme Fear.” Negative news headlines about exchange hacks, regulatory crackdowns, and overall market uncertainty flooded the media. Investors, gripped by panic, rapidly sold their Bitcoin holdings, causing a significant price drop from its previous high. This mass sell-off exacerbated the downward trend, creating a self-fulfilling prophecy of fear. The price plummeted, reflecting the widespread negative sentiment.
High-Greed Scenario and Impact on Bitcoin Price
The period leading up to Bitcoin’s peak in late 2017 showcased a “Extreme Greed” scenario. Media outlets widely touted Bitcoin as the next big thing, attracting a surge of new investors, many of whom lacked a thorough understanding of the underlying technology or risks involved. This created a speculative bubble. The price soared rapidly, driven by FOMO (fear of missing out) and excessive optimism. However, this unsustainable level of enthusiasm ultimately proved to be a precursor to a significant correction.
Visual Representation of Bitcoin Price and Fear & Greed Index, Bitcoin Fear And Greed
The visual representation would be a line graph. The X-axis would represent time (e.g., months or years), and the Y-axis would have two scales: one for Bitcoin’s price (in USD) and another for the Fear & Greed Index (0-100). Two lines would be plotted on this graph: one representing Bitcoin’s price fluctuations over time and the other representing the Fear & Greed Index values. Ideally, the graph would clearly show how periods of high fear correlate with price drops, and periods of high greed often precede price corrections. The graph would demonstrate the inverse relationship, but not a perfect one-to-one correlation, between investor sentiment and Bitcoin’s price.
Understanding the Bitcoin Fear and Greed Index is crucial before investing. Market sentiment significantly impacts price fluctuations, so informed decisions are key. If you’re ready to navigate this volatility and participate in the Bitcoin market, learning how to buy Bitcoin is the next step; check out this guide on How To Buy Bitcoin In India to get started.
Ultimately, managing risk based on the Fear and Greed Index remains vital for successful Bitcoin investment.
Understanding Bitcoin’s Fear and Greed Index is crucial for navigating the volatile market. The index reflects investor sentiment, which significantly impacts price fluctuations. To make informed decisions, it’s essential to know the current market value; you can check the current price by visiting this helpful resource: How Much Does 1 Bitcoin Cost. Ultimately, monitoring both the Fear and Greed Index and the actual Bitcoin price provides a more complete picture for investment strategies.
Bitcoin’s price volatility often reflects the market sentiment captured by the “Bitcoin Fear and Greed Index.” Understanding this index is crucial before making any investment decisions; if you’re ready to navigate this market, learning how to purchase Bitcoin is the next step. For a straightforward guide, check out this resource on How To Purchase Bitcoin and then carefully consider the Fear and Greed Index before committing funds.
Understanding Bitcoin’s Fear and Greed Index requires historical context. To grasp the volatility, consider how dramatically the price fluctuated; for example, checking How Much Was Bitcoin In 2013 reveals significant price swings even in its early years. This early price action significantly influenced the development of the Fear and Greed Index, helping to establish its baseline and highlighting the inherent risk associated with Bitcoin investment.
Bitcoin’s Fear and Greed Index often fluctuates wildly, reflecting the market’s emotional state. Understanding these shifts is crucial, and one factor to consider is the movement of large investors. Recent data on Bitcoin Whale Exchange Inflows suggests a potential correlation; significant inflows might indicate a bearish sentiment among whales, potentially exacerbating existing fear in the market and influencing the overall index.