
Bitcoin Halving Countdown
The Bitcoin halving is a significant event in the cryptocurrency world, occurring approximately every four years. This event reduces the rate at which new Bitcoins are created, impacting the cryptocurrency’s inflation rate and often influencing its price and market sentiment. Understanding the mechanics and historical impact of halvings is crucial for anyone invested in or following the Bitcoin ecosystem.
Bitcoin Halving: Event Mechanics and Significance
The Bitcoin halving is a programmed event hardcoded into the Bitcoin protocol. It reduces the block reward—the amount of Bitcoin miners receive for successfully adding a block of transactions to the blockchain—by half. This directly affects the rate of Bitcoin inflation. Before the first halving, miners received 50 BTC per block. After the first halving, this dropped to 25 BTC, then to 12.5 BTC, and currently stands at 6.25 BTC. This reduction in the supply of newly minted Bitcoins is designed to control inflation and maintain Bitcoin’s scarcity over time. The halving’s significance lies in its predictable nature and its potential impact on the supply and demand dynamics of the Bitcoin market. The reduced supply, coupled with consistent or increasing demand, theoretically puts upward pressure on the price.
Historical Impact of Bitcoin Halvings on Price and Market Sentiment
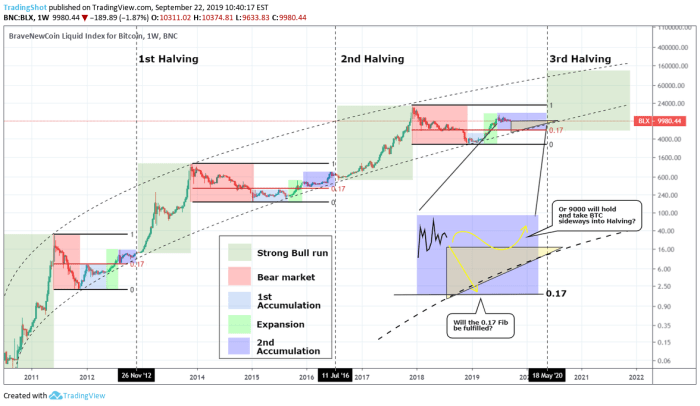
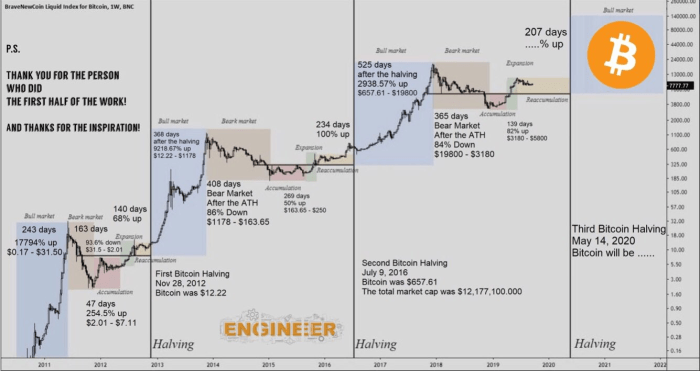
Previous Bitcoin halvings have been followed by periods of significant price appreciation, although the timing and magnitude of these price increases have varied. The first halving in November 2012 saw a gradual price increase over the following year. The second halving in July 2016 was followed by a more pronounced price surge, leading to a significant bull market. The third halving in May 2020 also witnessed a substantial price increase, albeit with some volatility. However, it’s crucial to note that other factors, such as macroeconomic conditions, regulatory changes, and market sentiment, also play a significant role in Bitcoin’s price movements. Attributing price changes solely to halvings would be an oversimplification. While historical data suggests a positive correlation between halvings and price increases, it’s not a guaranteed outcome.
Anticipated Effects of the Upcoming Halving Compared to Past Events
Predicting the precise impact of the upcoming halving is challenging. While past halvings have shown a positive correlation with price increases, several factors could influence the outcome differently this time. These include the current macroeconomic climate, the overall regulatory landscape for cryptocurrencies, and the level of institutional adoption of Bitcoin. Comparing the upcoming halving to previous events requires considering the differences in market maturity, regulatory environment, and overall investor sentiment. The current market is significantly more mature than it was during the earlier halvings, meaning that the impact might be less dramatic or manifest differently. The increased institutional investment in Bitcoin could also dampen the volatility typically associated with halving events.
Timeline of Key Events Surrounding Past Bitcoin Halvings
To illustrate the historical context, a timeline outlining key events surrounding past halvings is presented below. Note that this timeline focuses on price movements and market sentiment in relation to the halving events. It is not exhaustive and other relevant factors are not explicitly included.
| Halving Date | Block Reward Before Halving | Block Reward After Halving | Notable Price Movements (Approximate) | Market Sentiment |
|---|---|---|---|---|
| November 28, 2012 | 50 BTC | 25 BTC | Gradual increase over the following year | Generally bullish, but with periods of consolidation |
| July 9, 2016 | 25 BTC | 12.5 BTC | Significant price surge in the following months | Strong bullish sentiment, leading to a significant bull market |
| May 11, 2020 | 12.5 BTC | 6.25 BTC | Substantial price increase, followed by volatility | Bullish sentiment, although market volatility increased |
The Countdown Clock: Bitcoin Halving Countdown Clock
A Bitcoin halving countdown clock serves as a crucial tool for investors, traders, and enthusiasts alike, providing a visual representation of the time remaining until this significant event. Its utility extends beyond simple timekeeping, offering valuable insights and facilitating informed decision-making in the volatile cryptocurrency market.
The countdown clock’s primary purpose is to track the progression towards the Bitcoin halving, a programmed event that reduces the rate at which new Bitcoins are created. This reduction in supply often influences market dynamics, leading to potential price fluctuations. By visually displaying the remaining time, the clock allows individuals to anticipate the halving and adjust their strategies accordingly.
Countdown Clock Functionality and Types
A variety of countdown clocks cater to different user needs. Simple clocks display only the remaining time until the halving, using days, hours, minutes, and seconds. More interactive clocks may incorporate additional features such as historical halving data, price charts correlated with past halvings, or even community forums for discussion. Some advanced clocks could integrate real-time Bitcoin price feeds, allowing users to observe the market’s reaction as the halving approaches. For example, a sophisticated clock might display a historical price chart alongside the countdown, highlighting price movements in the weeks and months leading up to previous halvings. This allows users to compare current market behavior with past trends.
Hypothetical Bitcoin Halving Countdown Clock User Interface
Imagine a website or app displaying a large, centrally located digital clock showing the time remaining until the next halving. Below the clock, a concise summary of the halving event could be presented, explaining its significance. To the right, a dynamically updating graph could illustrate the Bitcoin price over the past year, highlighting key price movements. Below the graph, a table could compare the previous halvings, showing the date, Bitcoin price before and after, and percentage change. The bottom section could include news articles and social media feeds related to the halving, keeping users informed of current market sentiment and expert opinions. The overall design should be clean, uncluttered, and easy to navigate, ensuring a user-friendly experience.
Benefits of Countdown Clocks for Market Analysis and Prediction
While predicting precise market movements is impossible, countdown clocks provide a valuable framework for analysis. By observing market behavior in the lead-up to previous halvings, investors can identify potential patterns and trends. For example, analyzing historical data alongside a countdown clock could reveal if a particular price increase or decrease consistently occurs in the weeks or months before the event. This type of observation could inform trading strategies and risk management decisions. However, it’s crucial to remember that past performance is not indicative of future results. The use of a countdown clock should be considered one factor among many in a comprehensive market analysis strategy, not a standalone predictive tool.
Market Speculation and Price Predictions
The Bitcoin halving, a significant event in the cryptocurrency’s lifecycle, invariably sparks intense speculation regarding its impact on price. While the halving reduces the rate of new Bitcoin creation, its effect on market price is complex and far from guaranteed. Numerous factors beyond the halving itself influence Bitcoin’s value, leading to a wide range of predictions.
Diverse Perspectives on Halving’s Price Impact
The halving’s impact on Bitcoin’s price is a subject of ongoing debate. Bullish analysts often point to the reduced supply as a primary driver of price appreciation, arguing that decreased inflation will increase scarcity and thus value. They often cite previous halvings as evidence, noting price increases following those events. Conversely, bearish analysts emphasize that the halving is already priced into the market, meaning its impact might be minimal or even negative. They highlight macroeconomic factors, regulatory uncertainty, and the potential for market corrections as reasons for price stagnation or decline. Some analysts take a more neutral stance, acknowledging the potential for both upward and downward price movements depending on various intertwined market conditions.
Comparison of Price Prediction Models and Their Limitations
Several models attempt to predict Bitcoin’s price post-halving. Some use on-chain metrics, such as the stock-to-flow model, which correlates Bitcoin’s scarcity with its price. Others employ technical analysis, identifying price patterns and indicators to forecast future movements. However, all models have limitations. On-chain metrics may not fully capture the impact of external factors like regulatory changes or widespread market sentiment. Technical analysis relies on historical patterns that may not accurately predict future behavior. Furthermore, the inherent volatility of the cryptocurrency market makes precise price predictions extremely challenging, regardless of the model employed. For example, the stock-to-flow model, while popular, has been inaccurate in predicting price movements in the past, illustrating the limitations of relying on a single predictive model.
Factors Influencing Bitcoin’s Price
Beyond the halving itself, numerous factors influence Bitcoin’s price. Macroeconomic conditions, such as inflation rates and overall market sentiment, play a significant role. Regulatory developments, both positive and negative, can significantly impact investor confidence and price. Adoption rates by businesses and institutions also influence demand and price. Technological advancements within the Bitcoin ecosystem, such as the development of the Lightning Network, can also contribute to price fluctuations. Finally, the actions of large investors (“whales”) can cause significant short-term price volatility. For instance, the 2020-2021 bull run was partially fueled by increased institutional adoption, while the 2022 bear market was partly attributed to macroeconomic factors like rising interest rates.
Market Sentiment and Investor Psychology
Market sentiment and investor psychology are crucial drivers of Bitcoin’s price. Periods of high investor confidence, often fueled by positive news or technological advancements, tend to lead to price increases. Conversely, periods of fear, uncertainty, and doubt (FUD), often triggered by negative news or regulatory crackdowns, can cause significant price drops. The behavior of individual investors and institutional players alike contributes to these sentiment shifts, creating a dynamic and often unpredictable market. The psychology of herd behavior and fear of missing out (FOMO) also significantly influence price volatility.
Bullish vs. Bearish Arguments Regarding the Halving
| Bullish Arguments | Bearish Arguments |
|---|---|
| Reduced supply leads to increased scarcity and higher prices. | Halving is already priced in; minimal price impact expected. |
| Historical precedent shows price increases after previous halvings. | Macroeconomic factors and regulatory uncertainty outweigh halving’s impact. |
| Increased institutional adoption will drive demand. | Market corrections and potential bear market are likely. |
| Positive market sentiment and FOMO will push prices higher. | Negative market sentiment and fear will drive prices down. |
Mining and Network Security Implications
The Bitcoin halving, a programmed event that reduces the block reward paid to miners, significantly impacts the profitability of mining operations and, consequently, the security of the Bitcoin network. Understanding these implications is crucial for assessing the long-term health and stability of the cryptocurrency.
The halving directly affects miners’ profitability by reducing their income per block mined. This reduction forces miners to reassess their operational costs, including electricity, hardware maintenance, and facility expenses. Less profitable operations may be forced to shut down, while others may need to increase efficiency or seek alternative revenue streams to remain viable. This dynamic plays a crucial role in shaping the overall mining landscape.
Miner Profitability and Incentives
The halving creates a scenario where miners must adapt to maintain profitability. This adaptation can involve various strategies, including upgrading to more energy-efficient hardware, optimizing mining pools for better returns, or diversifying revenue streams through services like transaction fee processing. Those who fail to adapt risk becoming unprofitable and exiting the network, leading to a potential reduction in overall mining power. The incentive for miners remains the accumulation of Bitcoin, but the rate of accumulation is directly impacted by the halving. Successful adaptation relies on a miner’s ability to reduce costs or increase efficiency.
Consequences of Reduced Miner Rewards on Network Security, Bitcoin Halving Countdown Clock
A decrease in miner rewards can lead to a decline in the network’s overall hash rate—the measure of computational power securing the blockchain. A lower hash rate makes the network more vulnerable to 51% attacks, where a malicious actor controls more than half of the network’s mining power to potentially reverse transactions or manipulate the blockchain. However, the extent of this vulnerability depends on several factors, including the resilience of miners to adapt and the overall market conditions influencing the price of Bitcoin. Historically, while hash rate has temporarily dipped after halvings, it has generally recovered and often surpassed previous highs.
Historical Relationship Between Halving and Hash Rate Changes
Historically, Bitcoin halvings have been followed by periods of both short-term hash rate decline and subsequent growth. For example, after the 2016 halving, the hash rate initially experienced a temporary dip, but subsequently recovered and exceeded previous levels. This trend suggests that the market adapts and miners find ways to adjust their operations to remain profitable, ultimately contributing to the network’s security. While short-term volatility is expected, the long-term trend generally indicates resilience and adaptation within the mining community.
Comparison of Current Mining Landscape to Previous Halving Cycles
The current mining landscape differs from previous cycles in several key aspects. The increasing dominance of large, professional mining operations, coupled with advancements in mining hardware technology, has led to a more concentrated and sophisticated mining ecosystem. This concentration, while potentially increasing efficiency, also raises concerns about centralization and the potential impact of regulatory changes on mining profitability. Previous halvings saw a more decentralized landscape, with smaller miners playing a more significant role. The current situation requires a nuanced understanding of the potential effects of the halving on this more consolidated industry structure.
Projected Changes in Block Rewards and Mining Difficulty
The following chart illustrates the projected changes in block rewards and mining difficulty following the next halving. Note that these are projections and may vary based on several factors, including Bitcoin’s price and the overall computational power dedicated to mining.
| Halving Event | Block Reward (BTC) | Projected Difficulty Adjustment |
|—|—|—|
| Before Halving | 6.25 BTC | Variable, adjusts every 2016 blocks based on network hash rate |
| After Halving | 3.125 BTC | Increase in difficulty to maintain 10-minute block times |
The projected difficulty adjustment after the halving aims to maintain the average block time around 10 minutes. If the hash rate decreases significantly, the difficulty will adjust downwards; conversely, if the hash rate increases, the difficulty will adjust upwards. This automatic adjustment mechanism is a key feature of Bitcoin’s self-regulating nature.
Long-Term Implications and Future Outlook
The Bitcoin halving, a predictable event reducing the rate of new Bitcoin creation, has profound long-term implications for its adoption, value, and influence on the broader cryptocurrency landscape. While predicting the future with certainty is impossible, analyzing historical trends and understanding the mechanics of Bitcoin’s design allows for informed speculation on potential scenarios.
Bitcoin’s scarcity is a core tenet of its value proposition. Halvings, by reducing the supply of newly minted coins, contribute to this scarcity, potentially driving up demand and price. However, other factors, such as regulatory changes, technological advancements, and overall market sentiment, significantly influence Bitcoin’s price trajectory.
Bitcoin’s Price and Market Dominance
The halving’s impact on Bitcoin’s price is complex and not always immediately apparent. Historically, previous halvings have been followed by periods of significant price appreciation, though the timing and magnitude of these increases have varied. For instance, the 2012 halving was followed by a period of relatively slow growth, while the 2016 halving preceded a substantial bull run. The 2020 halving saw a price surge, but this was also influenced by other factors like increased institutional adoption. A scenario where the halving leads to a gradual price increase over several years is plausible, reflecting a slow burn of increased scarcity. Alternatively, a more dramatic, short-term price surge followed by consolidation could occur, similar to previous cycles. Ultimately, the price will depend on a confluence of factors beyond the halving itself. Market dominance, the percentage of the total cryptocurrency market capitalization held by Bitcoin, could increase post-halving if the price appreciates faster than other cryptocurrencies. However, the rise of competing cryptocurrencies and innovative blockchain technologies could limit Bitcoin’s dominance.
Impact on the Broader Cryptocurrency Market
The Bitcoin halving doesn’t exist in a vacuum; it impacts the broader cryptocurrency market. A significant price increase in Bitcoin often leads to a positive “ripple effect,” boosting the overall market sentiment and potentially increasing the prices of altcoins. This is because many investors view Bitcoin as a safe haven and a barometer for the entire crypto space. Conversely, a period of Bitcoin price stagnation or decline after the halving could negatively affect the broader market, leading to a general downturn. The correlation between Bitcoin’s price and altcoin performance is not always perfect, but a significant move in Bitcoin’s price usually influences other cryptocurrencies to some degree.
Risks and Challenges Associated with the Halving
While the halving is generally viewed positively, several risks and challenges exist. The most significant risk is the potential for a market correction. Even if the halving leads to a price increase, periods of price volatility are common, and sharp corrections are possible. Another challenge is the potential for increased network congestion due to increased transaction volume. Higher transaction fees could result, potentially hindering Bitcoin’s usability. Furthermore, regulatory uncertainty remains a persistent risk, with governments worldwide grappling with how to regulate cryptocurrencies. Negative regulatory changes could dampen the positive impact of the halving.
Bitcoin Market Forecast for the Year Following the Halving
Predicting the Bitcoin market with precision is inherently difficult. However, considering historical trends and the current market conditions, a scenario of increased price volatility in the immediate aftermath of the halving seems likely. This volatility could manifest as a period of price appreciation followed by a correction, or vice versa. Over the course of the year, a gradual increase in price, driven by the halving’s effect on scarcity, is a reasonable expectation, provided there are no major negative shocks to the market, such as a significant regulatory crackdown or a major security breach on the Bitcoin network. The extent of this price increase will depend on factors like investor sentiment, technological developments, and macroeconomic conditions. A conservative estimate could be a price range between X and Y USD, but this is highly speculative and subject to considerable uncertainty. This forecast is based on the observation that previous halvings have generally been followed by periods of price appreciation, but the timing and magnitude of these increases have varied significantly. It is crucial to remember that this is a speculative forecast, not a guaranteed outcome.
Frequently Asked Questions (FAQs)
This section addresses common queries surrounding the Bitcoin halving, a significant event in the Bitcoin network’s lifecycle. Understanding the halving’s mechanics and potential impact is crucial for anyone involved in the cryptocurrency market.
Bitcoin Halving Explained
The Bitcoin halving is a programmed event that reduces the rate at which new Bitcoins are created. Approximately every four years, the reward miners receive for verifying transactions on the Bitcoin blockchain is cut in half. This built-in mechanism controls Bitcoin’s inflation rate, aiming for a gradual decrease in newly minted coins over time. The halving is a core component of Bitcoin’s deflationary design.
Timing of the Next Bitcoin Halving
While the exact date and time can fluctuate slightly depending on the block generation time, the next Bitcoin halving is expected to occur around April 2024. The precise moment will be determined when a specific block is mined, triggering the reward reduction. This event is anticipated with considerable interest within the cryptocurrency community.
Bitcoin Halving’s Effect on Price
Historically, Bitcoin’s price has often experienced periods of significant growth following previous halvings. This is attributed to the decreased supply of newly mined Bitcoins, potentially increasing scarcity and driving demand. However, it’s crucial to remember that past performance is not indicative of future results, and many other factors influence Bitcoin’s price. For example, the 2012 halving was followed by a period of relative price stagnation before a substantial bull run began, and the 2016 halving similarly preceded a significant price increase. These past events suggest a potential correlation, but not a guaranteed outcome.
Risks Associated with the Halving
While the halving is often viewed positively, it’s not without potential downsides. The price may not increase as expected, and even a price decrease is possible due to various market factors. Increased miner difficulty and reduced profitability could lead to a period of consolidation or even a decline in the network’s hashrate (the computational power securing the network). Furthermore, macroeconomic conditions and regulatory changes can significantly outweigh the impact of the halving itself.
Preparing for the Bitcoin Halving
Preparing for the halving involves a nuanced approach depending on individual circumstances and risk tolerance. For investors, diversification is key. It’s advisable to avoid making significant investment decisions solely based on halving predictions. Thorough research and a long-term perspective are crucial. For Bitcoin miners, understanding the potential impact on profitability and adapting mining strategies accordingly is essential. Staying informed about market trends and technological developments will help navigate the post-halving landscape effectively.
Illustrative Examples
Visual representations can significantly enhance our understanding of Bitcoin halving’s impact. By presenting data graphically, we can more easily identify trends and relationships that might be missed in raw numerical form. The following visualizations illustrate the historical price behavior around halvings and project future mining difficulty adjustments.
Bitcoin Price and Halving Events
This chart would display Bitcoin’s price over time, highlighting the dates of previous halving events. The x-axis represents time, and the y-axis represents Bitcoin’s price in USD. Each halving event would be clearly marked on the chart, perhaps with a vertical line and label. The data would be sourced from reputable cryptocurrency price tracking websites. The chart type would ideally be a line graph, allowing for a clear visualization of price fluctuations leading up to, during, and after each halving. A notable feature would be the observation of price increases following previous halvings, although it’s crucial to note that correlation doesn’t equal causation; other market factors undoubtedly play a role. For example, the chart would show the price surge after the 2012 halving and again after the 2016 halving, allowing for visual comparison and analysis of the timeframes involved. The chart’s title could be “Bitcoin Price and Halving Events (2012-Present)”.
Projected Mining Difficulty After the Next Halving
This chart would depict the projected change in Bitcoin’s mining difficulty following the next halving. The x-axis would represent time, possibly showing a range of months or quarters after the halving. The y-axis would represent the mining difficulty, perhaps normalized to a baseline value before the halving (set to 100%). The data would be based on projections derived from existing models that consider factors like hash rate growth and block generation times. A line graph would be appropriate here, showing a gradual increase in mining difficulty over time as miners adjust their computational power to maintain profitability. The chart might also include a shaded area representing a range of possible difficulty values, acknowledging the inherent uncertainty in future hash rate growth. For example, the chart could project a 100% increase in difficulty within six months, illustrating the anticipated increase in computational power needed to maintain profitability in the post-halving environment. A realistic range of possible outcomes would also be displayed, indicating the level of uncertainty in such predictions. The chart’s title could be “Projected Bitcoin Mining Difficulty Increase Post-Halving”.
Bitcoin Halving: Key Facts and Figures
This infographic would present a concise summary of key information related to Bitcoin halvings. The layout could be visually appealing, using a combination of text, icons, and charts. For instance, the infographic might be divided into sections: “What is a Bitcoin Halving?”, “Halving History”, “Impact on Price”, “Impact on Mining”, and “Future Outlook”. Each section would contain relevant data presented clearly and concisely. For example, “Halving History” might show a timeline of past halvings, including the date and the resulting block reward reduction. “Impact on Price” could include a small bar chart showing price changes after previous halvings. The infographic would use clear and concise language, avoiding technical jargon where possible. The use of color and visual cues would improve readability and memorability. The overall design would aim for a clean and professional aesthetic, making the information easy to digest at a glance.