
Plataformas para Monitorear el Valor de Bitcoin en Tiempo Real
Tracking Bitcoin’s real-time value is crucial for investors and traders. Numerous platforms offer this service, each with its strengths and weaknesses. Choosing the right platform depends on individual needs and preferences, considering factors like user interface, features, and data reliability.
Comparison of Bitcoin Price Tracking Platforms
The selection of a suitable platform hinges on individual needs and preferences. The following table compares five popular platforms, highlighting their features, advantages, and disadvantages.
| Platform Name | Features | Pros | Cons |
|---|---|---|---|
| CoinMarketCap | Real-time Bitcoin price, historical data, market capitalization, trading volume, and cryptocurrency news. Offers a wide range of cryptocurrencies beyond Bitcoin. | Comprehensive data, user-friendly interface, large community, extensive historical data. | Can be susceptible to occasional data discrepancies due to the aggregation of data from various exchanges. |
| CoinGecko | Similar to CoinMarketCap, providing real-time pricing, historical data, market cap, and trading volume. Also includes community scores and developer data. | Detailed metrics, good visualization, and a wide range of supported cryptocurrencies. Strong focus on data accuracy and transparency. | The interface might feel slightly less intuitive than CoinMarketCap for some users. |
| Binance | Real-time Bitcoin price on their exchange, order books, trading charts, and trading tools. Primarily focused on trading activity. | Direct access to trading, reliable pricing for their exchange, and advanced charting tools. | Primarily focused on trading; less emphasis on broader market overview or historical data compared to CoinMarketCap or CoinGecko. |
| Kraken | Similar to Binance, offering real-time pricing, order books, and trading charts specific to their exchange. | Reliable pricing for their exchange, secure platform, and good reputation. | Like Binance, primarily a trading platform; less emphasis on broader market overview. |
| TradingView | Provides real-time Bitcoin charts, technical indicators, and a wide range of charting tools. Integrates with various exchanges. | Excellent charting capabilities, many technical indicators, customizable layouts, and a large community. | Can be overwhelming for beginners due to its advanced features. Free version may have limitations. |
Reliability and Accuracy of Bitcoin Pricing Data Sources
The accuracy and reliability of Bitcoin pricing data depend heavily on the data source. Platforms that aggregate data from multiple exchanges generally provide a more balanced view, though they might still experience minor discrepancies. Exchanges themselves are typically reliable for pricing on their specific platform, but their data might not reflect the broader market perfectly. The frequency of updates also affects accuracy; real-time data is more accurate than data updated less frequently. Delays in updating data can lead to inaccuracies, particularly during periods of high volatility.
Risks Associated with Unreliable Sources
Using unreliable sources for Bitcoin pricing can lead to several risks. Incorrect price information can result in poor investment decisions, leading to financial losses. Manipulated data from fraudulent sources can lead to scams and theft of funds. Relying on inaccurate data can also lead to missed opportunities or incorrect market analysis. Therefore, it is crucial to select reputable and verified sources for obtaining real-time Bitcoin price data.
Factores que Afectan el Valor de Bitcoin en Tiempo Real: Valor Bitcoin Tiempo Real
Bitcoin’s price, a notoriously volatile asset, is influenced by a complex interplay of factors that constantly shift and interact. Understanding these influences is crucial for anyone navigating the cryptocurrency market. This section details the key elements that impact Bitcoin’s real-time value.
News Events and Bitcoin’s Price
Global news events, whether political, economic, or technological, significantly affect Bitcoin’s price. Positive news, such as the adoption of Bitcoin by a major corporation or positive regulatory developments, often leads to increased demand and price appreciation. Conversely, negative news, such as a major security breach on a cryptocurrency exchange or stricter regulatory crackdowns, can trigger sell-offs and price declines. For example, the announcement of Elon Musk’s Tesla accepting Bitcoin as payment initially caused a surge in price, while subsequent concerns about Bitcoin’s energy consumption led to a price correction. Similarly, changes in macroeconomic conditions, like rising inflation or interest rate hikes, can also impact investor sentiment and consequently Bitcoin’s value. Geopolitical instability can also create uncertainty, driving investors towards or away from Bitcoin as a safe haven asset.
Supply and Demand Dynamics in the Bitcoin Market
Like any asset, Bitcoin’s price is fundamentally determined by the interaction of supply and demand. Bitcoin’s limited supply of 21 million coins acts as a deflationary pressure, potentially driving up its price over the long term as demand increases. However, short-term price fluctuations are heavily influenced by the balance of buyers and sellers in the market. Increased demand, driven by factors such as institutional investment, widespread adoption, or positive market sentiment, generally leads to price increases. Conversely, decreased demand, perhaps due to negative news, regulatory uncertainty, or profit-taking, can cause price drops. The scarcity of Bitcoin is a key factor contributing to its perceived value, and this scarcity is further emphasized by the halving events that reduce the rate of new Bitcoin creation.
Cryptocurrency Regulations and Bitcoin’s Price
Government regulations significantly impact the cryptocurrency market. Positive regulatory developments, such as the clarification of tax laws or the establishment of clear regulatory frameworks, can boost investor confidence and lead to price increases. Conversely, negative regulatory news, like outright bans or strict restrictions on cryptocurrency trading, can trigger sharp price declines. Different jurisdictions have varying approaches to regulating cryptocurrencies, and these differences can lead to significant price discrepancies across exchanges. The regulatory landscape is constantly evolving, making it a critical factor to monitor for understanding Bitcoin’s price movements.
Major Cryptocurrency Exchange Activities and Market Impact
The activities of major cryptocurrency exchanges play a crucial role in shaping Bitcoin’s price. Large-scale buy or sell orders from institutional investors or whales can cause significant price swings. Similarly, exchange listings or delistings can influence the accessibility and liquidity of Bitcoin, affecting its price. Security breaches or other operational issues at major exchanges can also trigger negative market sentiment and price drops. The level of trading volume on these exchanges is a key indicator of market activity and can influence price volatility. For example, a sudden surge in trading volume coupled with a significant price increase often indicates strong buying pressure.
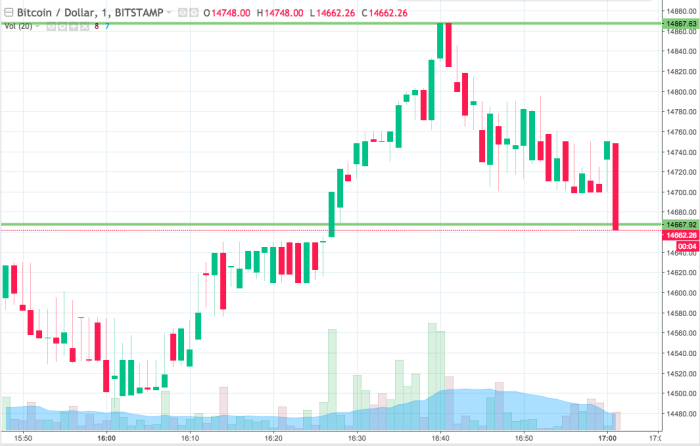
Análisis Técnico del Valor de Bitcoin en Tiempo Real
Technical analysis provides a framework for understanding Bitcoin’s price movements by studying historical price and volume data. While not a crystal ball, it offers valuable insights into potential trends and momentum shifts, allowing traders to make more informed decisions. However, it’s crucial to remember that Bitcoin’s price is influenced by numerous factors beyond purely technical indicators, making accurate predictions challenging.
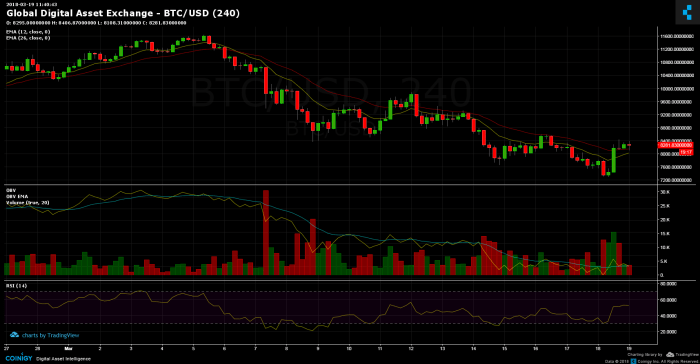
Moving Averages
Moving averages smooth out price fluctuations, revealing underlying trends. Common types include simple moving averages (SMA), exponential moving averages (EMA), and weighted moving averages (WMA). SMAs calculate the average price over a defined period, while EMAs give more weight to recent prices, making them more responsive to current market conditions. WMAs allow for customized weighting schemes. For example, a 50-day SMA might indicate a long-term trend, while a 20-day EMA could highlight shorter-term momentum. A bullish crossover occurs when a shorter-term moving average crosses above a longer-term moving average, suggesting a potential upward trend. Conversely, a bearish crossover signals a potential downward trend. For instance, a 20-day EMA crossing above a 50-day SMA could be interpreted as a bullish signal, prompting traders to consider buying.
Relative Strength Index (RSI)
The RSI measures the magnitude of recent price changes to evaluate overbought or oversold conditions. It ranges from 0 to 100. Readings above 70 generally suggest an overbought market, indicating a potential price correction or reversal. Readings below 30 often signal an oversold market, potentially suggesting a price bounce. For example, an RSI of 80 might suggest that Bitcoin is overbought and prone to a price drop, while an RSI of 20 might indicate that the market is oversold and a price increase is possible. However, it’s important to note that the RSI can remain in overbought or oversold territory for extended periods, particularly in strong trending markets.
Moving Average Convergence Divergence (MACD)
The MACD is a momentum indicator that shows the relationship between two moving averages. It consists of a MACD line (the difference between two exponential moving averages) and a signal line (a moving average of the MACD line). Buy signals often occur when the MACD line crosses above the signal line, suggesting increasing momentum. Sell signals typically arise when the MACD line crosses below the signal line. For example, a bullish MACD crossover, where the MACD line crosses above the signal line, could be interpreted as a positive sign for Bitcoin’s price, potentially indicating an upward trend. Conversely, a bearish crossover would suggest the opposite. However, false signals can occur, and confirmation from other indicators is often recommended.
Limitations of Technical Analysis in Predicting Bitcoin’s Price, Valor Bitcoin Tiempo Real
Technical analysis, while helpful, has limitations in predicting Bitcoin’s price. Bitcoin’s price is susceptible to extreme volatility driven by factors outside traditional market dynamics, such as regulatory changes, technological developments, media hype, and large-scale investor behavior. These unpredictable events can override technical signals, leading to inaccurate predictions. Furthermore, the relatively short history of Bitcoin compared to established markets limits the reliability of historical patterns in predicting future movements. Over-reliance on technical indicators without considering fundamental analysis and broader market context can result in significant losses.
Estrategias para Invertir en Bitcoin Considerando su Valor en Tiempo Real
Investing in Bitcoin, a highly volatile asset, requires a well-defined strategy to navigate its real-time price fluctuations. Understanding different approaches and their associated risks is crucial for successful Bitcoin investment. This section explores several strategies, highlighting their potential rewards and inherent dangers.
Dollar-Cost Averaging (DCA)
Dollar-cost averaging is a strategy that involves investing a fixed amount of money at regular intervals, regardless of the Bitcoin price. This approach mitigates the risk of investing a lump sum at a market peak. By consistently buying Bitcoin over time, you average your purchase price, reducing the impact of short-term price volatility. For example, investing $100 per week for a year will result in a diversified purchase history, lessening the impact of any single week’s price movement. The reward lies in potentially accumulating more Bitcoin over time compared to a single, large investment made at an unfavorable price point. However, DCA does not guarantee profits; if the price of Bitcoin consistently declines during your investment period, you’ll still experience losses, although potentially less significant than a lump-sum investment at the same period’s peak.
Swing Trading
Swing trading aims to capitalize on short-term price fluctuations, typically holding Bitcoin for a few days to several weeks. This strategy requires active monitoring of market trends and technical indicators to identify potential entry and exit points. Successful swing trading involves accurately predicting short-term price movements. For instance, a trader might buy Bitcoin when it shows signs of a bullish reversal after a temporary dip, aiming to sell when it reaches a predetermined profit target or encounters resistance. The potential rewards are significant, offering higher returns compared to DCA. However, the risks are equally substantial. Incorrectly predicting price movements can lead to substantial losses, especially during periods of high volatility. Furthermore, swing trading demands significant time and attention to monitor the market constantly.
Risk Management in Bitcoin Investment
Effective risk management is paramount in Bitcoin investing. Diversification, limiting investment amounts to only what one can afford to lose, and setting stop-loss orders are vital. Diversification means not putting all your eggs in one basket; allocating only a portion of your investment portfolio to Bitcoin reduces the overall impact of potential losses. Stop-loss orders automatically sell your Bitcoin if the price falls below a predetermined level, limiting potential losses. This is a crucial tool to manage risk in the highly volatile Bitcoin market. Regularly reviewing your investment strategy and adjusting it based on market conditions is also crucial. Staying informed about market trends and news that could impact Bitcoin’s price is essential for making informed decisions.
El Futuro del Valor de Bitcoin en Tiempo Real
Predicting the future price of Bitcoin is inherently speculative, yet analyzing current trends and expert opinions offers valuable insights into potential future scenarios. While no one can definitively say what Bitcoin’s price will be tomorrow, let alone in five years, understanding the factors influencing its value allows for informed speculation. This section explores various expert predictions and potential drivers of future price movements, culminating in a hypothetical scenario illustrating Bitcoin’s potential value in the next five years.
Expert Opinions and Predictions on Bitcoin’s Future Price
Numerous financial analysts and cryptocurrency experts offer varying predictions on Bitcoin’s future price. These predictions often differ significantly, reflecting the inherent volatility of the cryptocurrency market and the diverse methodologies used for forecasting. Some analysts, based on adoption rates and technological advancements, predict continued price growth, potentially reaching significantly higher values within the next five years. Others, however, point to regulatory uncertainty and potential market corrections as factors that could lead to lower prices. For instance, some analysts have predicted prices exceeding $100,000 within the next few years, while others suggest a more conservative approach, anticipating a range between $50,000 and $80,000. The divergence in predictions highlights the need for cautious optimism and thorough due diligence before making any investment decisions.
Factors Influencing Future Price Increases
Several factors could drive future price increases in Bitcoin. Increased institutional adoption, characterized by larger corporations and financial institutions integrating Bitcoin into their investment portfolios, could significantly boost demand and price. Furthermore, widespread global adoption as a legitimate form of payment and a store of value could also fuel price appreciation. Technological advancements, such as the development of the Lightning Network, which aims to improve transaction speeds and reduce fees, could also contribute to increased adoption and, consequently, higher prices. Finally, geopolitical instability and inflationary pressures in traditional fiat currencies could further enhance Bitcoin’s appeal as a hedge against inflation and a decentralized alternative.
Factors Influencing Future Price Decreases
Conversely, several factors could lead to price decreases. Increased regulatory scrutiny and potential government crackdowns on cryptocurrency exchanges and trading could dampen investor enthusiasm and lower prices. Significant security breaches or major hacks targeting Bitcoin exchanges could also negatively impact investor confidence and drive prices down. Furthermore, the emergence of competing cryptocurrencies with superior technology or features could potentially divert investment away from Bitcoin and lead to a decline in its value. Finally, large-scale selling pressure from institutional investors, or a general downturn in the global financial markets, could trigger a market correction, resulting in a decrease in Bitcoin’s price.
Hypothetical Scenario: Bitcoin’s Value in Five Years
Considering the aforementioned factors, a hypothetical scenario for Bitcoin’s value in five years could involve a period of volatility. Initially, a period of consolidation or even a slight decline could occur due to regulatory uncertainties or market corrections. However, assuming continued institutional adoption, technological advancements, and growing global acceptance, a gradual increase in price could follow. By the end of five years, this scenario suggests a potential price range between $75,000 and $120,000, with significant fluctuations along the way. This is based on the assumption that adoption continues to grow, but that regulatory hurdles and technological challenges are addressed or mitigated. This, of course, is purely speculative and should not be taken as financial advice. This hypothetical scenario emphasizes the importance of diversified investment strategies and thorough research before investing in Bitcoin or any other cryptocurrency.
Preguntas Frecuentes sobre el Valor de Bitcoin en Tiempo Real
This section addresses common questions regarding the real-time value of Bitcoin, clarifying its meaning, reliable sources for tracking it, the inherent risks and rewards of investing, and strategies for mitigating price volatility. Understanding these aspects is crucial for anyone considering Bitcoin as an investment.
Significado de “Valor Bitcoin en Tiempo Real”
“Valor Bitcoin en Tiempo Real” refers to the current market price of one Bitcoin at any given moment. Unlike historical data or predicted future values, this represents the price at which Bitcoin is being bought and sold on exchanges worldwide at that precise instant. This value is constantly fluctuating due to the continuous trading activity.
Dónde Encontrar el Valor de Bitcoin en Tiempo Real
Several reputable sources provide real-time Bitcoin price information. These platforms aggregate data from multiple exchanges to give a comprehensive and up-to-date view of the market. Choosing a reliable source is essential for making informed investment decisions. Examples include major cryptocurrency exchanges like Coinbase, Binance, Kraken, and dedicated financial news websites such as CoinDesk and Bloomberg. These sources usually display the price in multiple fiat currencies (USD, EUR, etc.).
Seguridad de Invertir en Bitcoin
Investing in Bitcoin carries both significant risks and potential rewards. The high volatility of Bitcoin’s price is a major risk factor; its value can fluctuate dramatically in short periods. This volatility is influenced by various factors including regulatory changes, market sentiment, technological developments, and macroeconomic conditions. On the other hand, the potential for high returns is a key attraction. However, this potential is coupled with the possibility of substantial losses. Before investing, thorough research and a risk tolerance assessment are vital. It’s also crucial to understand that Bitcoin is not regulated in the same way as traditional assets, making it a higher-risk investment.
Protegerse de las Fluctuaciones de Precio de Bitcoin
Managing risk when investing in Bitcoin requires a multifaceted approach. Diversification is a key strategy; don’t put all your eggs in one basket. Investing only a portion of your portfolio in Bitcoin and allocating the rest to other assets can significantly reduce overall portfolio volatility. Dollar-cost averaging, a method of investing a fixed amount at regular intervals regardless of price, can mitigate the impact of price fluctuations. Furthermore, setting stop-loss orders can help limit potential losses by automatically selling your Bitcoin if the price drops below a predetermined level. Finally, thorough research and understanding of market trends can help inform your investment decisions, though it doesn’t eliminate risk.
Visualización de Datos
Understanding Bitcoin’s price movements requires effective data visualization. A well-designed graph can quickly communicate complex price fluctuations and trends, making it easier to identify patterns and make informed decisions. The following description details a graph illustrating Bitcoin’s price behavior over the past year.
A line graph is the most suitable visualization for depicting Bitcoin’s price over time. The horizontal (x-axis) represents time, specifically the past 365 days, broken down into months or even weeks for better resolution. The vertical (y-axis) represents the price of Bitcoin in US dollars, ranging from the lowest price observed in the past year to the highest, with appropriate increments (e.g., $1,000 increments if the price range is significant, or smaller increments for a tighter range).
Bitcoin Price Fluctuations: A Year in Review
The line graph itself would depict the Bitcoin price, with each point on the line representing the closing price for a given day. The line would naturally fluctuate, reflecting the inherent volatility of the cryptocurrency market. Key data points should be highlighted. For instance, if Bitcoin experienced a significant price drop due to a specific event (like a regulatory announcement or market crash), that point would be clearly marked on the graph with a small annotation specifying the date and the approximate percentage drop. Conversely, significant price increases (bull runs) should also be highlighted with similar annotations, possibly using a different color or symbol for visual distinction.
The graph should include a clear legend explaining the meaning of the line, perhaps stating “Bitcoin Closing Price (USD)”. The title of the graph could be “Bitcoin Price Fluctuations: [Start Date] – [End Date]”. The axes should be clearly labeled, with the x-axis labeled “Date” and the y-axis labeled “Price (USD)”. A grid would aid in easily reading specific price levels and time points. Consider adding a moving average line (e.g., a 50-day or 200-day moving average) to help smooth out the short-term volatility and better identify long-term trends. This moving average would be a separate line, clearly distinguished from the main price line in the legend. Finally, including the source of the price data (e.g., “Source: CoinGecko”) adds credibility and transparency.
For example, let’s assume the lowest price in the past year was $15,000 and the highest was $30,000. The graph would show the line oscillating between these two extremes. A significant drop from $28,000 to $20,000 on October 26th could be annotated as “28% drop following regulatory uncertainty.” Conversely, a significant rise from $18,000 to $25,000 in March could be labeled “18% increase fueled by positive market sentiment.” These annotations would make the graph much more informative and insightful.